Collect Survey Data & Basic Workflow
Introduction to starting a new survey and collecting data points.
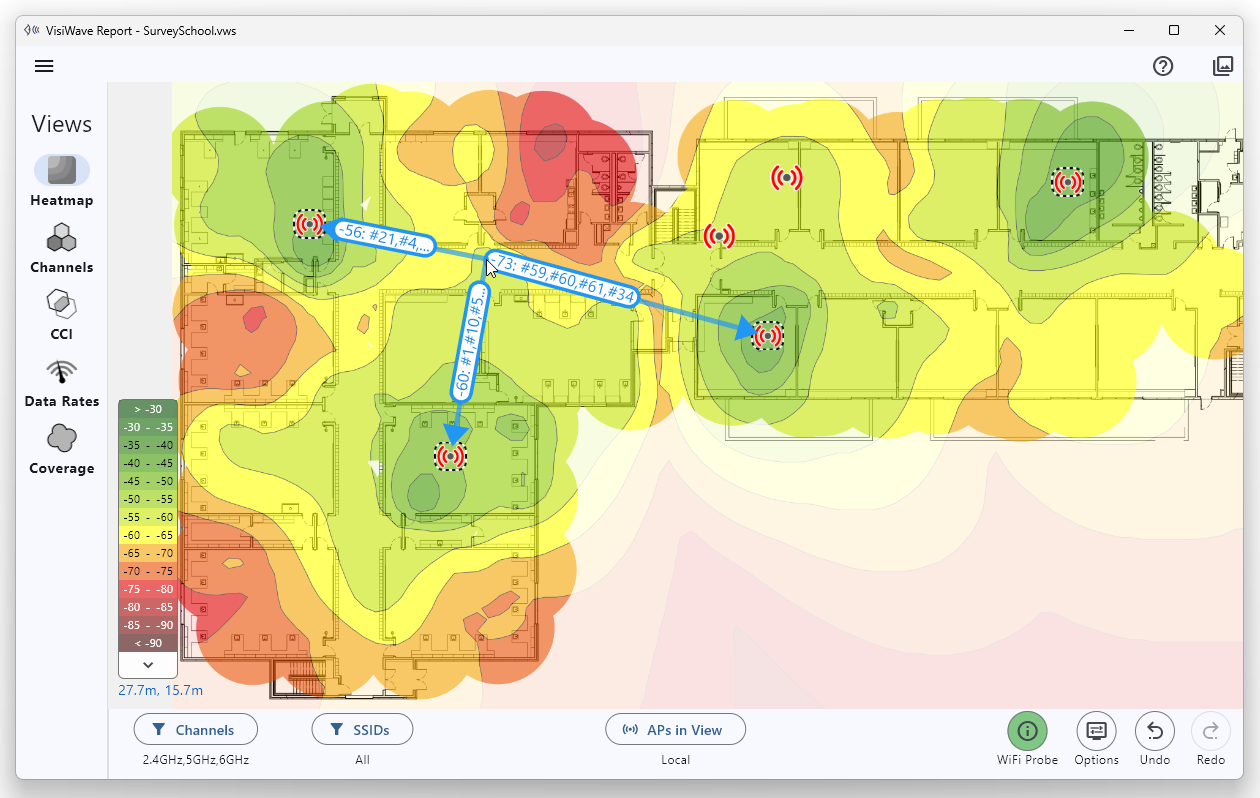
Visualize Your Wireless Network™
Easily perform professional wireless site surveys. Analyze your WiFi network, create coverage heatmaps, see coverage voids, view channel usage/overlap, and more.
WiFi wireless networks are everywhere. They are a critical component of most business infrastructures. They need to be examined, explained, and held accountable. VisiWave Site Survey is the software tool that shows you what's going on inside your wireless network. VisiWave provides advanced data collection and visualization capabilities that form a complete wireless LAN site survey solution that allows you to visualize the radio waves and demonstrate the effectiveness of your Wi-Fi coverage.
Prove whether coverage meets expectations across the survey area.
Reveal competing networks and noise sources impacting performance.
Communicate issues visually with heatmaps and view-specific insights.
Document improvements after AP moves, power changes, or channel plans.
Detect unexpected APs and find their location in the survey space.
Identify signals that extend beyond their desired borders.
For analysis, VisiWave hands you everything you want to know about your WiFi data. No sifting through mountains of confusing data or doing tedious labor.
VisiWave has support through Wi-Fi 6 and 6E (802.11a/b/g/n/ac/ax) including support for 2.4GHz, 5GHz, and 6GHz bands.
Lengthy lists of radios, APs, or data points were replaced with on-map visuals.
By leveraging proprietary algorithms that interpret radio signal strengths and other metadata from the collected data, VisiWave provides:
Download the free trial or purchase a license and start performing professional wireless site surveys in minutes.